Support
A support level is a concept in technical analysis, indicating when an asset has reached a price level that market participants are unwilling to continue selling, which causes the price to stop falling.
Support is a price level where downward movement may be restrained by accumulated demand at or around that price level.
A support level is a price level at which an asset may find difficulty falling below as traders look to buy around that level.
More and more buyers are active the closer the price gets to the support level.
Support can be described as:
- A price level at which a currency has trouble falling below.
- A price level at which buying is expected to take place.
Usually, the markets prove unwilling to let an asset drop below its support level, with buyers stepping in to raise the asset’s price higher again.
That makes them the opposite of resistance levels, which is a price level at which the markets prove unwilling to let an asset’s price rise any higher.
If an asset does move below its support level, then that support level has “been broken“.
Knowing where an asset’s support and resistance levels are can help traders choose the best time to enter a market, as well as where to put stops and limits.
Resistance
A resistance level is a concept in technical analysis, indicating when an asset has reached a price level that market participants are unwilling to continue buying, which causes the price to stop rising.
Resistance is a price level at which upward movement may be restrained by accumulated supply at or around that price level.
Resistance, or a resistance level, is the price level at which the rise in price is halted by the emergence of a growing number of sellers who wish to sell at that price.
More and more sellers will be active the closer the price gets to the resistance level.
Resistance levels are often used in conjunction with support levels or the point at which traders are unwilling to let an asset’s price drop much lower.
Traders will often identify areas of support and resistance in order to make decisions on trades, including when to place stop losses and profit targets.
If an asset does break through its resistance level, then some traders believe it will carry on rising in price, or “rally“, until a new resistance level is found.
Plotting Support and Resistance Levels
One thing to remember is that support and resistance levels are not exact numbers.
Often times you will see a support or resistance level that appears broken, but soon after find out that the market was just testing it.

Notice how the shadows of the candles tested the 1.4700 support level.
At those times it seemed like the price was “breaking” support.
In hindsight, we can see that the price was merely testing that level.
So how do we truly know if support and resistance were broken?
There is no definite answer to this question.
Some argue that a support or resistance level is broken if the price can actually close past that level.
However, you will find that this is not always the case.
Let’s take the same example from above and see what happened when the price actually closed past the 1.4700 support level.

In this case, the price had closed below the 1.4700 support level but ended up rising back up above it.
If you had believed that this was a real breakout and sold this pair, you would’ve been seriously hurtin’!
Looking at the chart now, you can visually see and come to the conclusion that the support was not actually broken, it is still very much intact and now even stronger.
Support was “breached” but only temporarily.
To help you filter out these false breakouts, you should think of support and resistance more as “zones” rather than concrete numbers.
One way to help you find these zones is to plot support and resistance on a line chart rather than a candlestick chart.
The reason is that line charts only show you the closing price while candlesticks add extreme highs and lows to the picture.
These highs and lows can be misleading because oftentimes they are just the “knee-jerk” reactions of the market.
It’s like when someone is doing something really strange, but when asked about it, he simply replies, “Sorry, it’s just a reflex.”
When plotting support and resistance, you don’t want the reflexes of the market. You only want to plot its intentional movements.
Looking at the line chart, you want to plot your support and resistance lines around areas where you can see the price forming several peaks or valleys.

Other interesting tidbits about support and resistance:
- When the price passes through resistance, that resistance could potentially become support.
- The more often price tests a level of resistance or support without breaking it, the stronger the area of resistance or support is.
- When a support or resistance level breaks, the strength of the follow-through move depends on how strongly the broken support or resistance had been holding.

With a little practice, you’ll be able to spot potential forex support and resistance areas easily.
how support and resistance are normally traded
In the most basic way, this is how support and resistance are normally traded:
Trade the “Bounce”
- Buy when the price falls towards support.
- Sell when the price rises towards resistance.
Trade the “Break”
- Buy when the price breaks up through resistance.
- Sell when the price breaks down through support.
The Bounce
As the name suggests, one method of trading support and resistance levels is right after the bounce.
Many retail forex traders make the error of setting their orders directly on support and resistance levels and then just waiting for their trade to materialize.
Sure, this may work at times but this kind of trading method assumes that a support or resistance level will hold without price actually getting there yet.
You might be thinking, “Why don’t I just set an entry order right on the line? That way, I am assured the best possible price.”
When playing the bounce, we want to tilt the odds in our favor and find some sort of confirmation that the support or resistance will hold.
For example, instead of simply buying right off the bat, we want to wait for it to bounce off support before entering.

If you’ve been looking to go short, you want to wait for it to bounce off resistance before entering.
By doing this, you avoid those moments where price moves fast and breaks through support and resistance levels. From experience, catching a falling knife when trading can get really bloody!
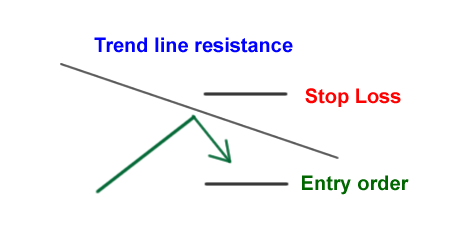
The Break
In a perfect world, support and resistance levels would hold forever. In a perfect forex trading world, we could just jump in and out whenever price hits those major support and resistance levels and earn loads of money.
The fact of the matter is that these levels break… often.
So, it’s not enough to just play bounces. You should also know what to do whenever support and resistance levels breaks!
There are two ways to play breaks in trading: the aggressive way or the conservative way.
The Aggressive Way
The simplest way to play breakouts is to buy or sell whenever price passes convincingly through a support or resistance zone.
The keyword here is convincing because we only want to enter when the price passes through a significant support or resistance level with ease.
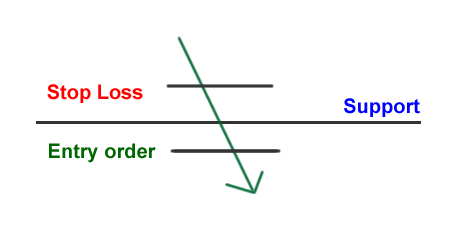
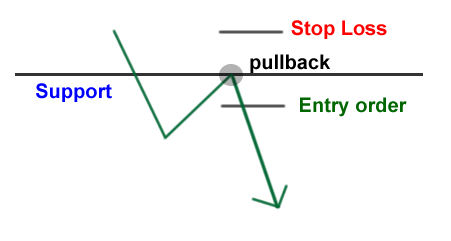
The Conservative Way
this conservative way is all about being patient.
Instead of entering right on the break, wait for the price to make a “pullback” to the broken support or resistance level, and enter after the price bounces.