A trend channel is a set of parallel trend lines defined by the highs and lows of an asset’s price action.
A trend channel, also sometimes called a price channel occurs when the price is moving between two parallel trendlines.
Trading channels can be drawn on charts to help see uptrends and downtrends.
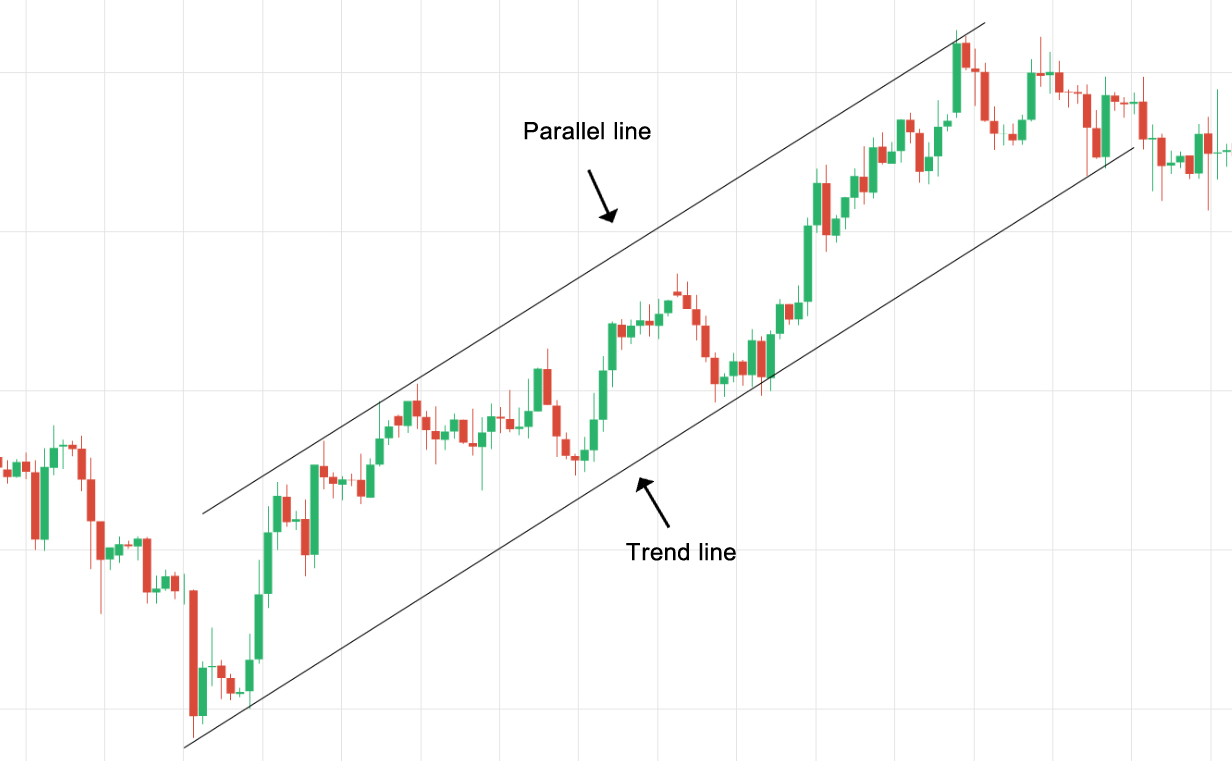
In a bullish trend, the trend line is plotted below the price action, while the trend channel line is positioned above the highs of the price movement.
In a bearish trend, the trend line is plotted above, while the trend channel line is below the price action.
In general, trend lines are used as entry signals because they play the role of a support level in a bullish trend and a resistance level in a bearish trend.
An entry signal is given when the price tests the trend line without violating it. When this happens, the trade is entered in the direction of the trend with a stop loss placed just below the trend line. The opposite trend line can be used as a price target at which to take profit.
For example, in an ascending channel, traders may use the test of the LOWER trend line as an entry for a trade with the trend. A long position is entered with a stop loss placed just below the lower trend line. The upper trend line can be used as the profit target.
Trend channel lines most often generate countertrend entry signals, since they act as a resistance in uptrends and support in downtrends.
For example, in an ascending channel, aggressive traders may use the test of the UPPER trend line as an entry for a trade against the trend (countertrend). A short position is entered with a stop loss placed just above the upper trend line. The lower trend line can be used as the profit target.
Types of Trend Channels
There are three types of channels:
- Ascending channel (higher highs and higher lows)
- Descending channel (lower highs and lower lows)
- Horizontal channel (ranging)
Some traders prefer to use the terms “rising channel” for an ascending channel and “falling channel” for a descending channel.
Ascending Channel
An ascending channel is a chart pattern formed from two upward trend lines drawn above and below a price representing resistance and support levels.
The ascending channel is also known as a “rising channel” and “channel up“.
The lower line is identified first, as running along the lows: it defines the trend line. The upper line (the “channel line”) is identified as parallel to the trendline, running along the highs.
It is a bullish chart pattern defined by a trend line supporting the series of higher lows and a diagonal resistance level connecting the higher highs.
When in the channel, prices are expected to bounce off both upper and lower boundaries; the more such reversals occur, the more reliable the pattern.

When the price is around the bottom trendline, look for long opportunities, although aggressive traders could trade long and/or short at both trend lines looking for a bounce or pullback.
Another way to trade this pattern is to wait for the price to break through either trendline.
A break out above the upper trendline generates a strong buy signal, while a break down below the lower trendline generates a strong sell signal.
When the price breaks through the trend line (low line), it might indicate a significant change in trend.
Breaking through the channel line (upper line), in contrast, suggests an acceleration of the existing trend.
Keep in mind that just like all the other patterns, channels might be prone to false or premature breakouts, which means that price may retreat back into the channel.
Ascending channels are useful due to their ability to predict overall changes in trends.
Ascending channels, like descending channels, are a tool for determining whether the trend in price will continue.
As long as prices remain within the ascending channel, the upward trend in price can be expected to continue.
Another strategy of using an ascending channel is to identify where the price fails to reach the upper line.
The failure to reach it often signifies trend exhaustion. This could be an early warning that the trend is going to reverse. The breach of the trend line (lower line) may be more likely to happen.
Ascending channels often appear within an overall downtrend in prices and represent either a continuation of the trend or a reversal of the trend.
The direction of the break will determine whether it’s a continuation or a reversal.
Descending Channel
A descending channel is a chart pattern formed from two downward trendlines drawn above and below a price representing resistance and support levels.
The descending channel pattern is also known as a “falling channel” or “channel down“.
The upper line is identified first, as running along the highs and is called the trendline.
The lower line (the “channel line”) is identified as parallel to the trendline, running across the bottom.
It is a bearish chart pattern defined by a trend line supporting the series of lower lows and a diagonal resistance level connecting the lower highs.
When in the channel, prices are expected to bounce off both upper and lower boundaries. The more such reversals occur, the more reliable the pattern.

When the price is around the upper trend line, look for short opportunities, although aggressive traders could trade long and/or short at both trend lines looking for a bounce or pullback.
Another way to trade this pattern is to wait for the price to break through either trendline.
A break out above the upper trendline generates a strong buy signal, while a break down below the lower trendline generates a strong sell signal.
When the price breaks through the trend line (upper line), it might indicate a significant change in trend.
Breaking through the channel line (lower line), in contrast, suggests an acceleration of the existing trend.
Keep in mind that just like all the other patterns, channels might be prone to false or premature breakouts, which means that price may retreat back into the channel.
Descending channels are useful due to their ability to predict overall changes in trends.
Descending channels, like ascending channels, are a tool for determining whether the trend in price will continue.
As long as prices remain within the descending channel, the downward trend in price can be expected to continue.
Another strategy of using a descending channel is to identify where the price fails to reach the lower line.
The failure to reach it often signifies trend exhaustion. This could be an early warning that the trend is going to reverse. The breach of the trend line may be more likely to happen.
Descending channels often appear within an overall uptrend in prices, and represent either a continuation of the trend or a reversal of the trend.
The direction of the break will determine whether it’s a continuation or a reversal.
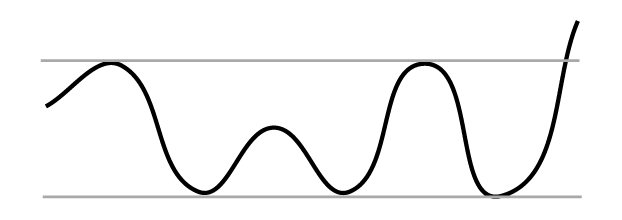
Horizontal Channel
A horizontal channel is a chart pattern formed from two parallel trend lines drawn above and below price representing resistance and support levels
Like ascending and descending channels, horizontal channels are formed by drawing trend lines for both high and low prices on a chart.
The difference between the other two is that a horizontal channel is characterized as having equal highs and lows.
If prices remain reasonably constant overall for some period of time, the slope of both trend lines used in the chart will appear horizontal, and a horizontal trend channel will be formed.
Horizontal Channel as Support and Resistance
Like all trend channels, price trades between support and resistance.
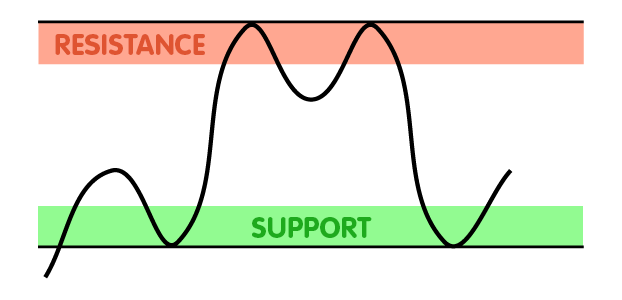
When the price is between a support level and a resistance level, without being particularly near either of them, it does not signal anything about the future price.
If the price is falling towards support, it indicates that it will reverse and rise again.
If the price is rising towards resistance, it indicates that it will reverse and fall back again.
Horizontal Channel Breakout
A break in prices outside of either trend line represents either a buy or a sell signal to traders.
If prices break above the upper resistance trend line, a buy signal is generated.
If prices break below the lower support trend line, a sell signal is generated.
Many traders believe that a horizontal trend channel doesn’t represent a horizontal trend as such, but merely a temporary interruption in a prevailing trend in either direction.
Other traders believe that a horizontal channel represents a “calm before the storm” of a major trend reversal.
Because of this ambiguity, horizontal channels should only be used in conjunction with other technical analysis tools.
Important things to remember about drawing trend channels:
When constructing a trend channel, both trend lines must be parallel to each other.
Generally, the bottom of the trend channel is considered a “buy zone” while the top of the trend channel is considered a “sell zone”.
Like in drawing trend lines, DO NOT EVER force the price to the channels that you draw!
A channel boundary that is sloping at one angle while the corresponding channel boundary is sloping at a different angle is not correct and could lead to bad trades.
When this happens, this chart pattern is no longer a trend channel but a triangle.
That said, trend channels don’t have to be completely parallel. Nor does 100% of price action have to fit within the channel.
A common mistake many traders make is that they only look for textbook price patterns.
They miss important information about price action and close their eyes to other important clues.
Notice the channel drawings below…