What is a 1-2-3 Trend Reversal Pattern?
The 1-2-3 trend reversal pattern is super simple to spot, occurs frequently in the markets, can be a powerful price action tool, and when traded correctly it can be used to identify market reversals and potential trade entries.
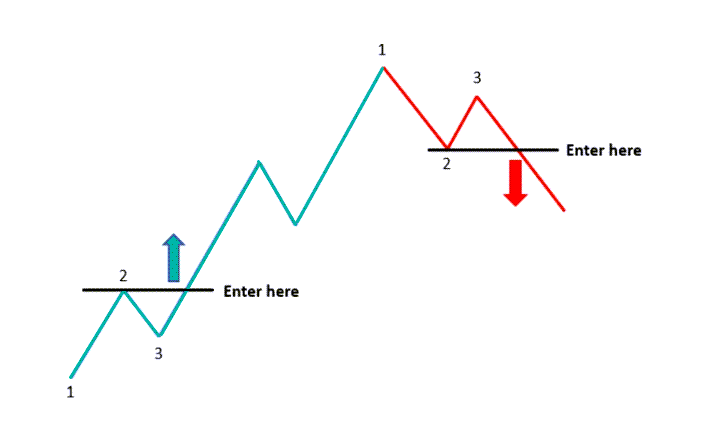
As the name implies the 1-2-3 trend reversal has three parts. it can be used for either bullish or bearish reversals, but the same three parts must form.

Price is moving lower in a downtrend before forming part #1. This is a move back higher against the trend or overall move currently in place.
Part #2 is a move with the trend, but crucially a new higher low is formed. for a bearish 1-2-3 reversal, this would be a new lower high.
Part #3 sees the price make a new move back higher and importantly break the recent swing high of part #1.
How to Identify a 1-2-3 Reversal
Below is a real chart of a 1-2-3 bullish trend reversal taking place.

Price had heavily sold off lower before forming part #1, the move back higher.
In part #2 price rotates lower, but this time we have a new higher low.
The 1-2-3 is completed when the price makes move #3 and moves above the recent swing high.
Note: some traders using the 1-2-3 reversal don’t wait for the recent high or low to break, but for the pattern to confirm we need to see the price move above or below.
Below is an example of a bearish 1-2-3 reversal taking place.

After the price was trending higher it formed a move lower. the trend did not continue as we get a new lower high. the 1-2-3 pattern is then confirmed when the price breaks lower and through the recent swing point.
Using the 1-2-3 pattern to Spot Market Reversals
Using the 1-2-3 pattern as a trend reversal pattern is the most common strategy. The reason for this is that it can help us quickly identify shifting momentum and catch a new trend early.
If we use 1-2-3 with other techniques such as double tops and bottoms, recent momentum and key level breaks, then we can quickly spot when a market is looking to reverse.
If we spot a 1-2-3 being formed we can then turn to using these other strategies to look for potential trade entries.
Whilst this pattern can be used to spot trends and market reversals, it can also be used to spot new potential trade opportunities.
The best way to do this is to watch the level that the price confirmed the 1-2-3 pattern and see if it holds as a new price flip level.
Because this level has recently been a support or resistance level, it will often flip and hold as a new support or resistance level.
An example of this is below;

The price formed a bullish 1-2-3 reversal pattern confirmed by the breakout higher. after breaking out higher, the price made a quick retrace and retest into the old resistance and new support level.
Using 1-2-3 pattern to Identify Major Range Breakouts
The 1-2-3 pattern is best and most commonly used to spot trend reversals, but you can also use it to identify when a range is breaking and to help you look for potential trade opportunities.
Whilst commonly used as a trend reversal pattern, you can also use the 1-2-3 to spot when a range is breaking or looking to potentially break.
This can be incredibly handy if you are a breakout trader or you look to make breakout and quick retest trades. Being able to spot momentum shifting could put you on the right side of the market.
The first chart below is of a ranging market that has just broken lower and through the range support level.

A closer look at the price action before the breakout shows that momentum was building to a breakout lower with a 1-2-3 pattern.
Inside the sideways range, the price had formed a lower high and was looking to complete part #3 of the 1-2-3 pattern with a breakout lower.

Being able to spot this 1-2-3 could help us either look for breakout trades as they are happening or as discussed below; look for trades when the price retests the breakout area.
If you take another quick look at the chart above; you will notice that after the price broke out of the range and confirmed the 1-2-3 pattern, it made a quick retrace higher. at this retest, it rejected the breakout area and formed a bearish pin bar reversal setup.
 Forex On $teroids


