Once upon a time, there was this insanely smart trader named Harold McKinley Gartley.
He had a stock market advisory service in the mid-1930s with a huge following.
This service was one of the first to apply scientific and statistical methods to analyze the stock market behavior.
According to Gartley, he was finally able to solve two of the biggest problems of traders: what and when to buy.
Soon enough, traders realized that these patterns could also be applied to other markets. Since then, various books, trading software, and other patterns (discussed below) have been made based on the Gartley.
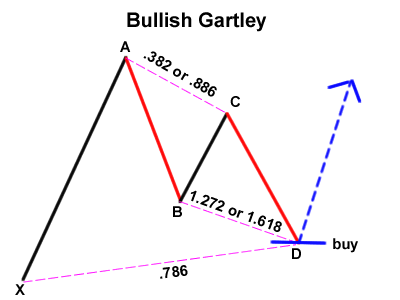
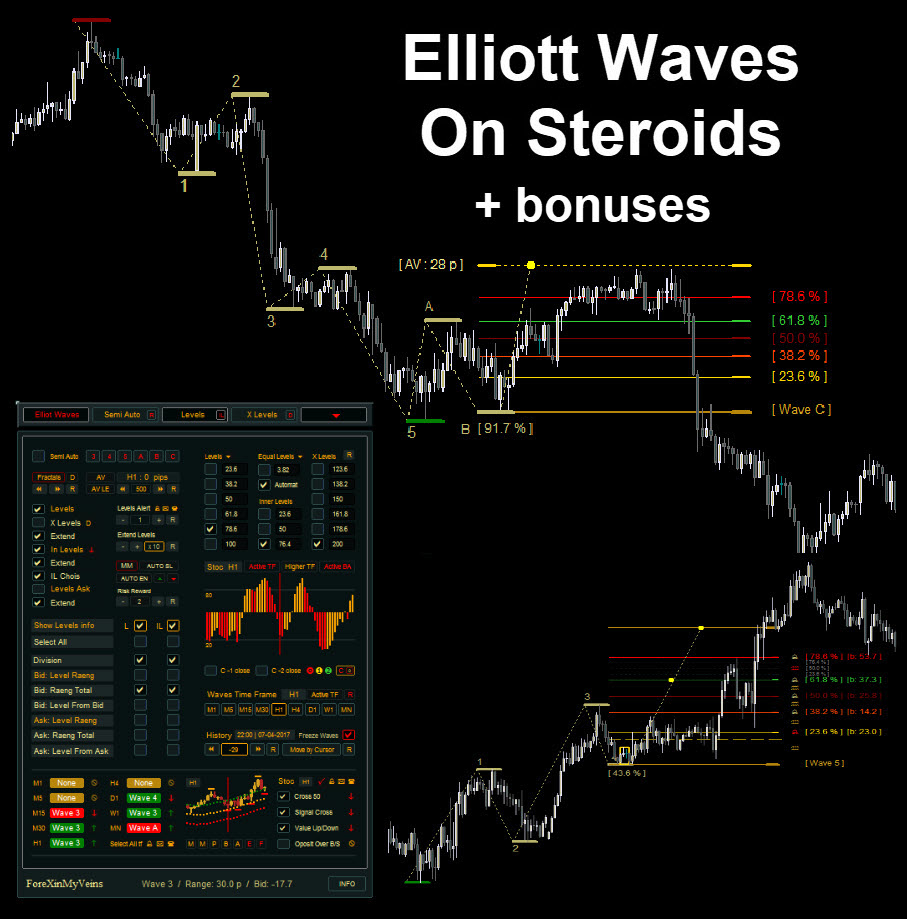
Gartley a.k.a. “222” Pattern
The Gartley “222” pattern is named for the page number it is found on in H.M. Gartleys book, Profits in the Stock Market.
These patterns normally form when a correction of the overall trend is taking place and are used to help traders find good entry points to jump in on the overall trend.


A Gartley forms when the price action has been going on a recent uptrend (or downtrend) but has started to show signs of a correction.
What makes the Gartley such a nice setup when it forms is the reversal points are a Fibonacci retracement and Fibonacci extension level. This gives a stronger indication that the pair may actually reverse.
This pattern can be hard to spot and once you do, it can get confusing when you pop up all those Fibonacci tools. The key to avoiding all the confusion is to take things one step at a time.
The “perfect” Gartley pattern has the following characteristics:
- Move AB should be the .618 retracement of move XA.
- Move BC should be either .382 or .886 retracement of move AB.
- If the retracement of move BC is .382 of move AB, then CD should be 1.272 of move BC. Consequently, if move BC is .886 of move AB, then CD should extend 1.618 of move BC.
- Move CD should be .786 retracement of move XA
Gartley Mutants: The Animals
As time went by, the popularity of the Gartley pattern grew and people eventually came up with their own variations.
For some odd reason, the discoverers of these variations decided to name them after animals (Maybe they were part of PETA?). Without further ado, here comes the animal pack…
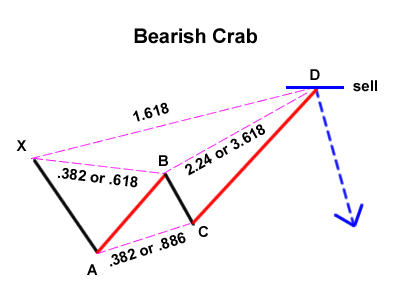
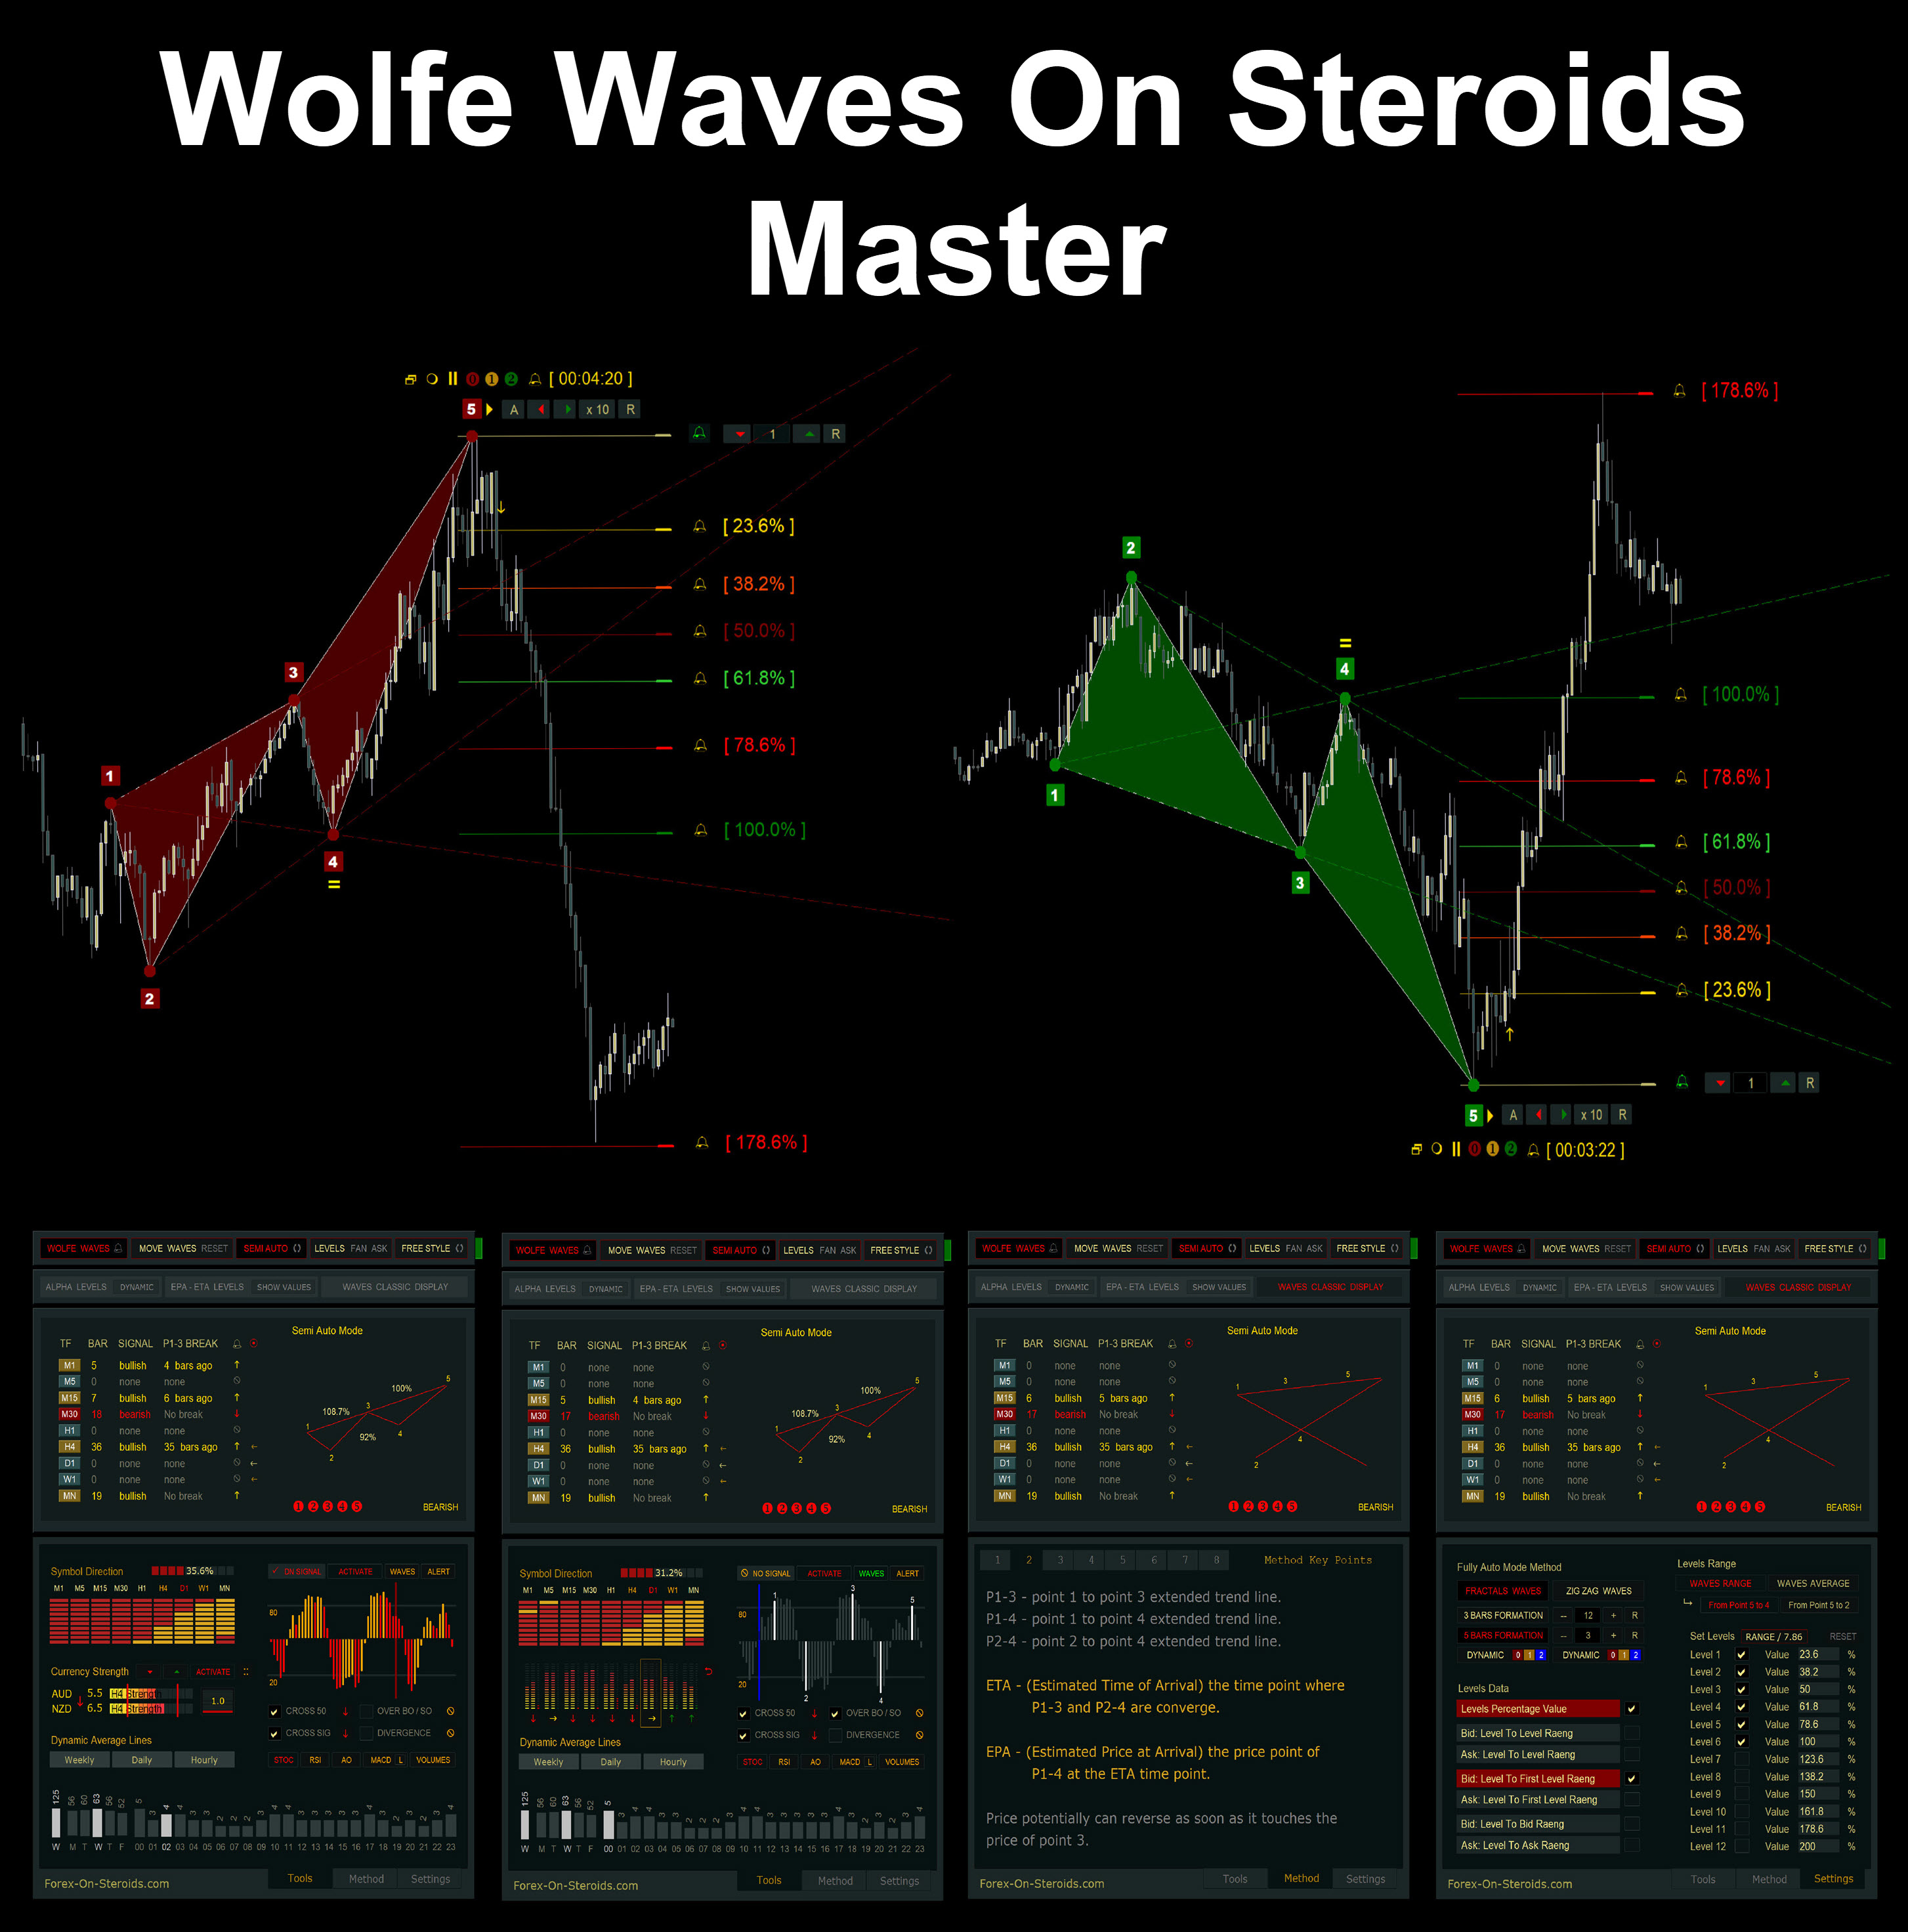
The Crab


In 2000, Scott Carney, a firm believer in harmonic price patterns, discovered the “Crab“.
According to him, this is the most accurate among all the harmonic patterns because of how extreme the Potential Reversal Zone (sometimes called “price better reverse or imma gonna lose my shirt” point) from move XA.
This pattern has a high reward-to-risk ratio because you can put a very tight stop loss. The “perfect” crab pattern must have the following aspects:
- Move AB should be the .382 or .618 retracement of move XA.
- Move BC can be either .382 or .886 retracement of move AB.
- If the retracement of move BC is .382 of move AB, then CD should be 2.24 of move BC. Consequently, if move BC is .886 of move AB, then CD should be 3.618 extension of move BC.
- CD should be 1.618 extension of move XA.
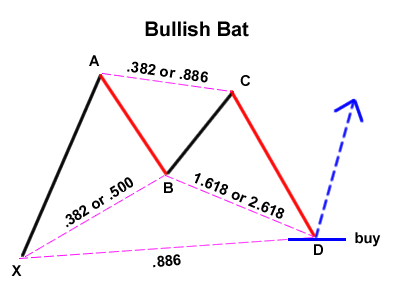
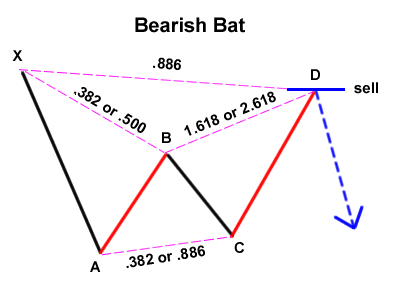
The Bat


Come 2001, Scott Carney founded another Harmonic Price Pattern called the “Bat.”
The Bat is defined by the .886 retracement of move XA as Potential Reversal Zone. The Bat pattern has the following qualities:
- Move AB should be the .382 or .500 retracement of move XA.
- Move BC can be either .382 or .886 retracement of move AB.
- If the retracement of move BC is .382 of move AB, then CD should be 1.618 extension of move BC. Consequently, if move BC is .886 of move AB, then CD should be 2.618 extension of move BC.
- CD should be .886 retracement of move XA.
The Butterfly


Then, there is the Butterfly pattern.
Like Muhammad Ali, if you spot this setup, you’ll surely be swinging for some knockout-sized pips!
Created by Bryce Gilmore, the perfect Butterfly pattern is defined by the .786 retracement of move AB with respect to move XA.
The Butterfly contains these specific characteristics:
- Move AB should be the .786 retracement of move XA.
- Move BC can be either .382 or .886 retracement of move AB.
- If the retracement of move BC is .382 of move AB, then CD should be 1.618 extension of move BC. Consequently, if move BC is .886 of move AB, then CD should extend 2.618 of move BC.
- CD should be 1.27 or 1.618 extension of move XA.