Articles
Candlesticks Patterns - predict potential future movements| 1057 views | Category: Candlesticks Patterns |
Candlestick patterns are a form of technical analysis used in stock trading and other financial markets like forex to predict future price movements.
These patterns are created by the movement of the opening and closing prices of a stock or currency pair, as well as the highest and lowest prices, over a specific period of time.
Candlestick patterns are created by the combination of the real body, which is the area between the opening and closing prices, and the upper and lower shadows, which represent the highest and lowest prices.

The patterns are visual representations of price action and help traders and investors understand market sentiment and make informed trading decisions.
READ MORE
What is Support & Resistance?| 1435 views | Category: Support and Resistance |
Support and resistance are one of the most widely used concepts in trading.
The support and resistance are specific price points on a chart expected to attract the maximum amount of either buying or selling.
The support price is a price at which one can expect more buyers than sellers. Likewise, the resistance price is a price at which one can expect more sellers than buyers.

If a bull market when the price moves up and then pulls back, the highest point reached before it pulled back is now resistance.
Resistance levels indicate where there will be a surplus of sellers.
When the price continues up again, the lowest point reached before it started back is now support.
Support levels indicate where there will be a surplus of buyers.
In this way, resistance and support are continually formed as the price moves up and down over time.
The reverse is true during a downtrend.
READ MORE
Trend Lines| 1211 views | Category: Support and Resistance |
Trend lines are probably the most common form of technical analysis in forex trading, and If drawn correctly, they can be as accurate as any other method.
Unfortunately, most forex traders don’t draw them correctly, or they try to make the line fit the market instead of the other way around.

In their most basic form, an Uptrend line is drawn along the bottom of identifiable support areas (valleys) and is known as an Ascending Trend Line.
In a Downtrend, the trend line is drawn along the top of identifiable resistance areas (peaks) and is known as a Descending Trend Line.
READ MORE
Channels| 1278 views | Category: Support and Resistance |
If we take a trend line and draw a parallel line at the same angle of the uptrend or downtrend, we will have created a “channel”.
Channels are just another tool in technical analysis that can be used to determine good places to buy or sell.
The upper trend line marks resistance and the lower trend line marks support. So both the tops and bottoms of channels represent potential areas of support or resistance.
Trend channels with a negative slope (down) are considered bearish and those with a positive slope (up) are considered bullish.

To create an up (ascending) channel, simply draw a parallel line at the same angle as an uptrend line and then move that line to a position where it touches the most recent peak. This should be done at the same time you create the trend line.
To create a down (descending) channel, simply draw a parallel line at the same angle as the downtrend line and then move that line to a position where it touches the most recent valley. This should be done at the same time you create the trend line.
When prices hit the LOWER trend line, this may be used as a buying area.
When prices hit the UPPER trend line, this may be used as a selling area.
READ MORE
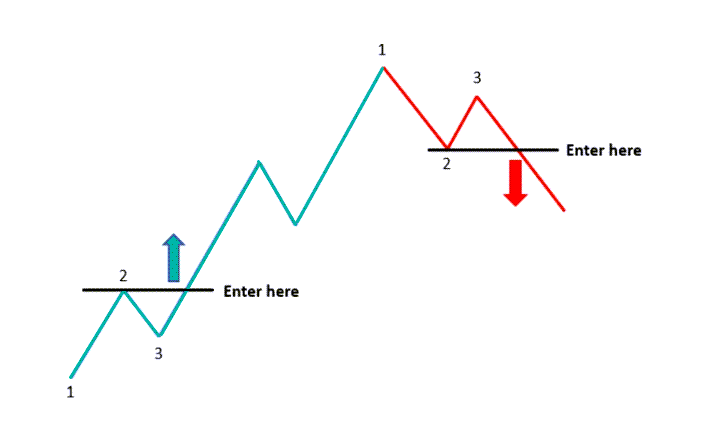
1-2-3 Pattern - Waves trading strategy| 1040 views | Category: Trand Trading - 1-2-3 Pattern |
1-2-3 pattern is a time-tested tool that is successfully used by traders worldwide. it is one of the major Price Action patterns that helps determine a possible direction of a price by accurately predicting changes in market sentiments at an early stage.
The pattern is a common formation made of 3 key elements that indicate that the trend has changed its direction, trend reversal. also, it may occur at the boundary of a trading range or the end of a trend retracement.
READ MORE
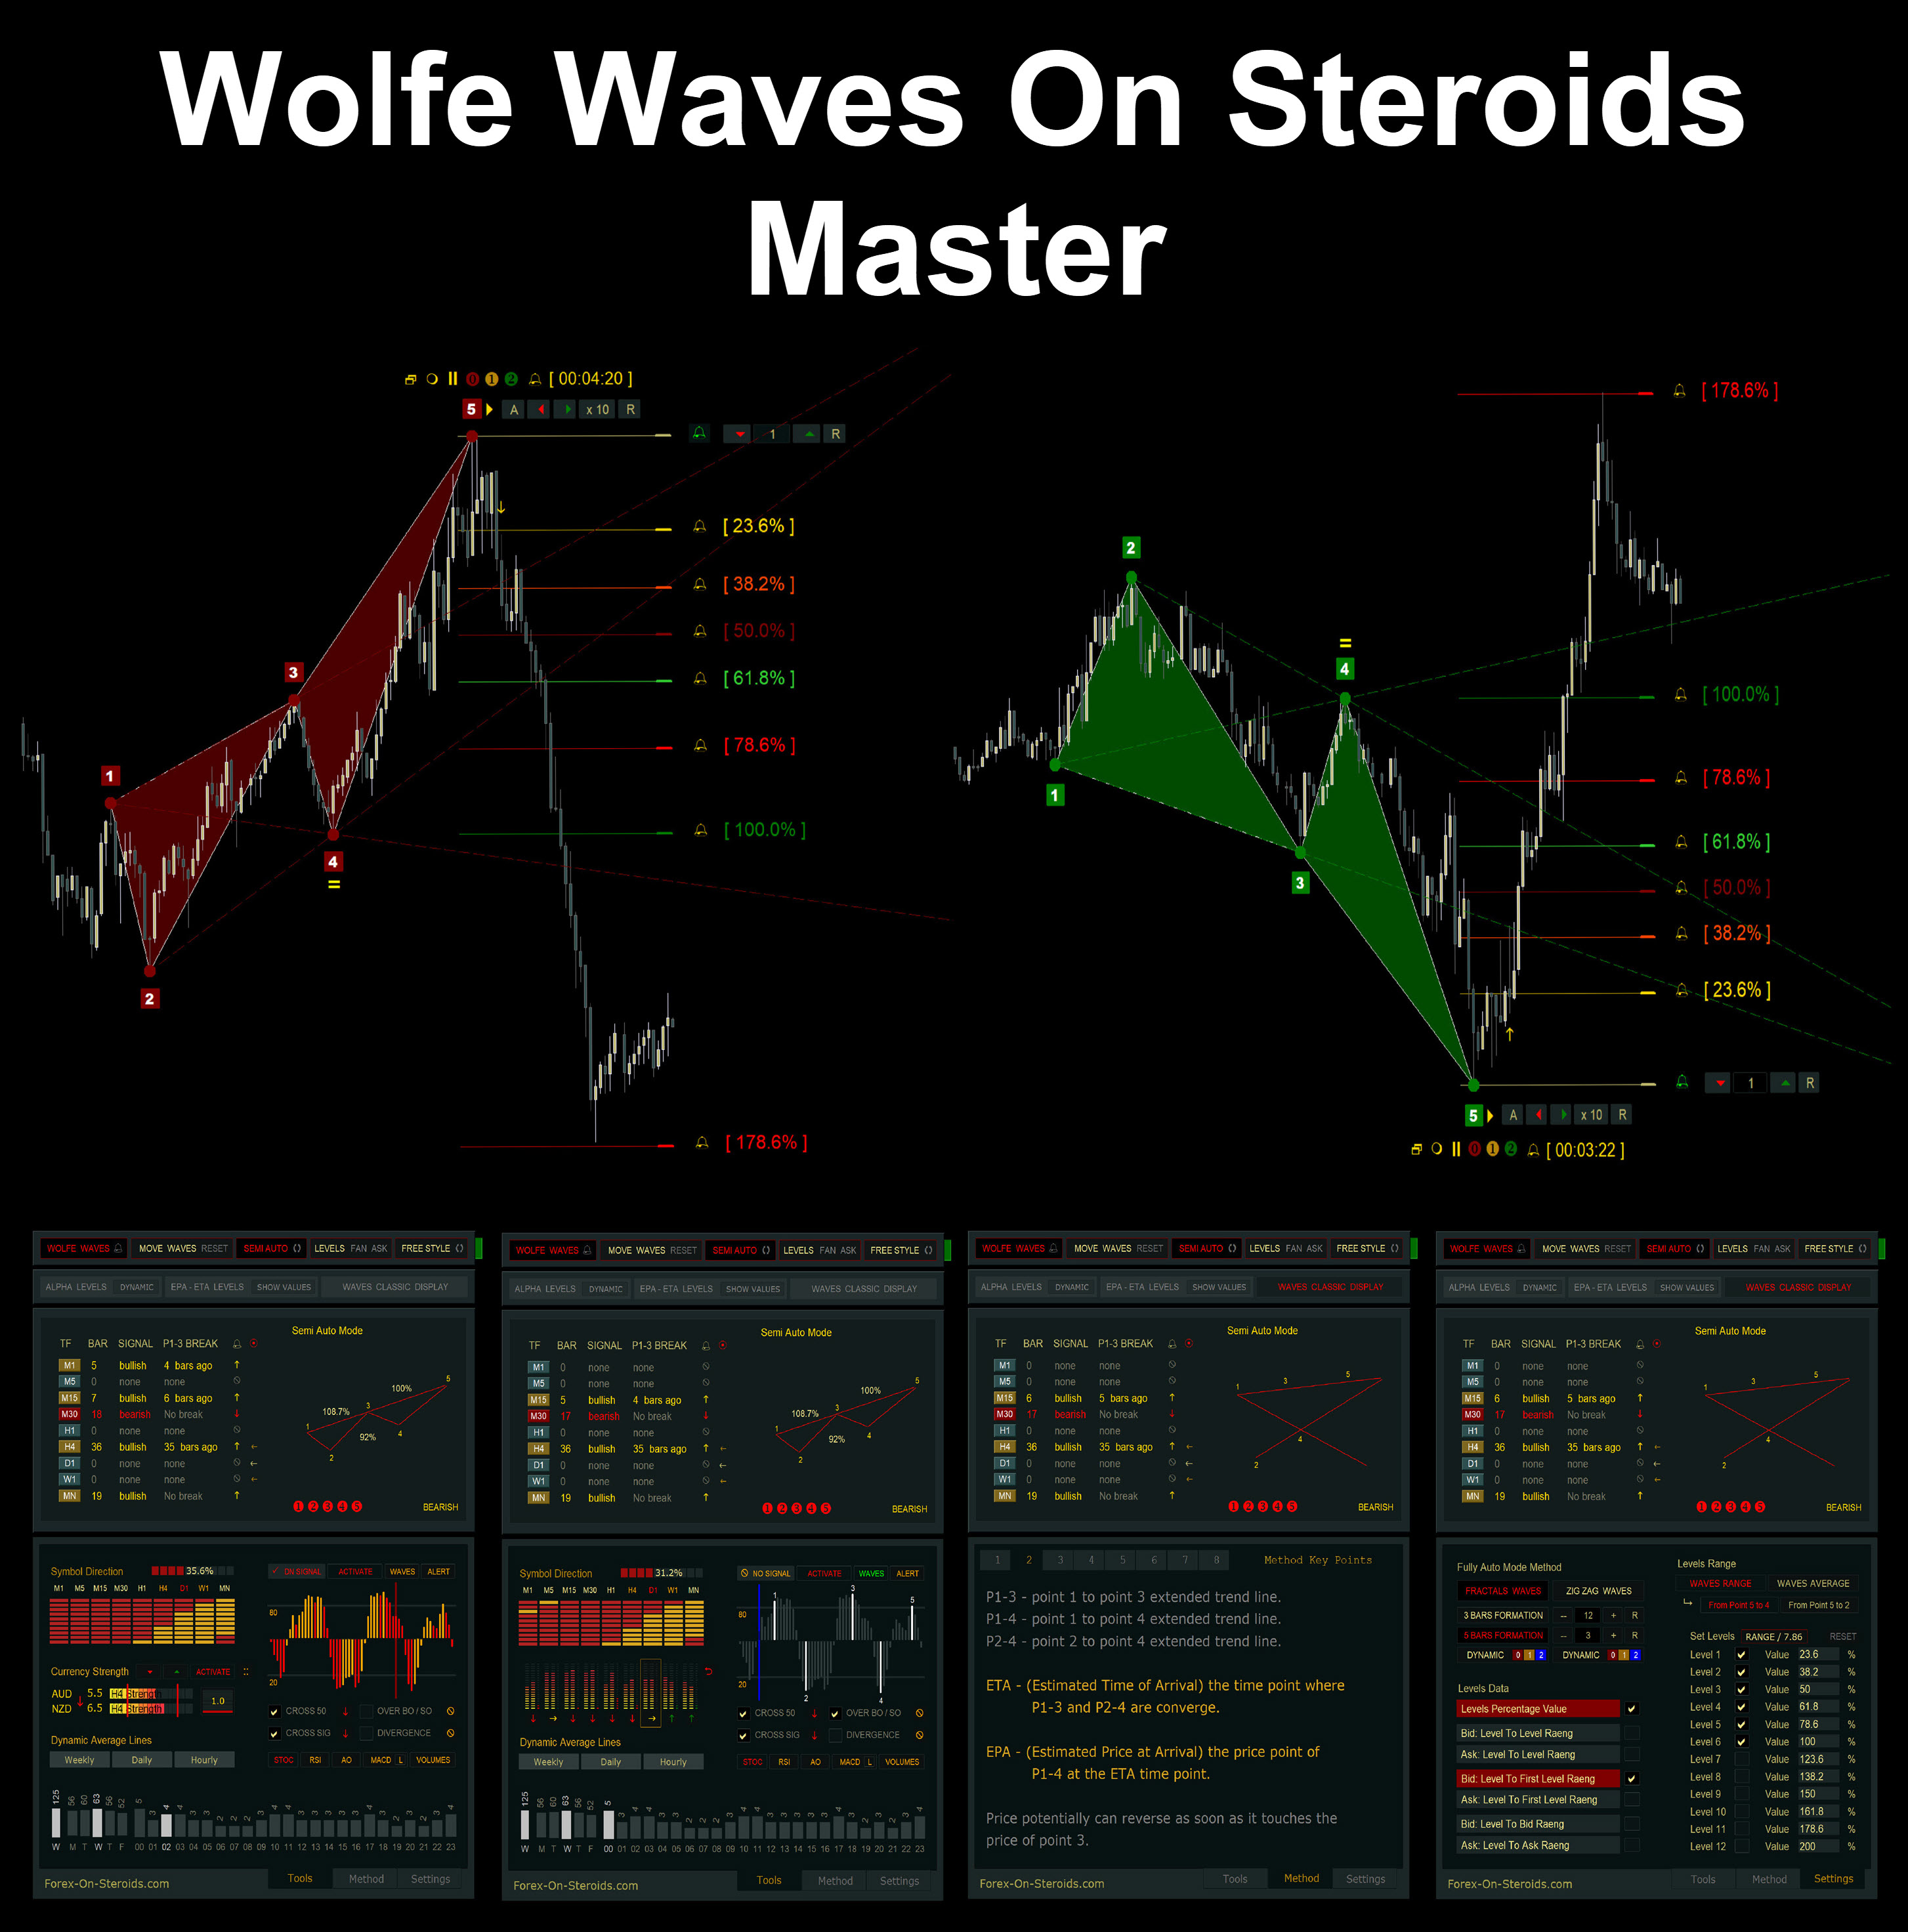
Wolfe waves - A better understanding of Bill Wolfe's method| 1752 views | Category: Wolfe Waves Pattern |
The Wolfe waves pattern is named after a trading guru called Bill Wolfe. He identified that when price action remains within a price channel and makes a false breakout on the fifth wave, it usually starts a reversal of the prevailing trend in the opposite direction.
He clarified that Wolfe waves can help traders find a terrific entry point in the market at the beginning of a potential reversal with a great risk-to-reward ratio. Moreover, it can also pinpoint a potential exit point or offer traders a price target based on the symmetric configuration of the price pattern.


READ MORE
show more articles